
Sixty-eight percent of renters have a household salary below $50,000, and 49% of renters rent because they can’t afford to buy, according to new research from Forbes Advisor.
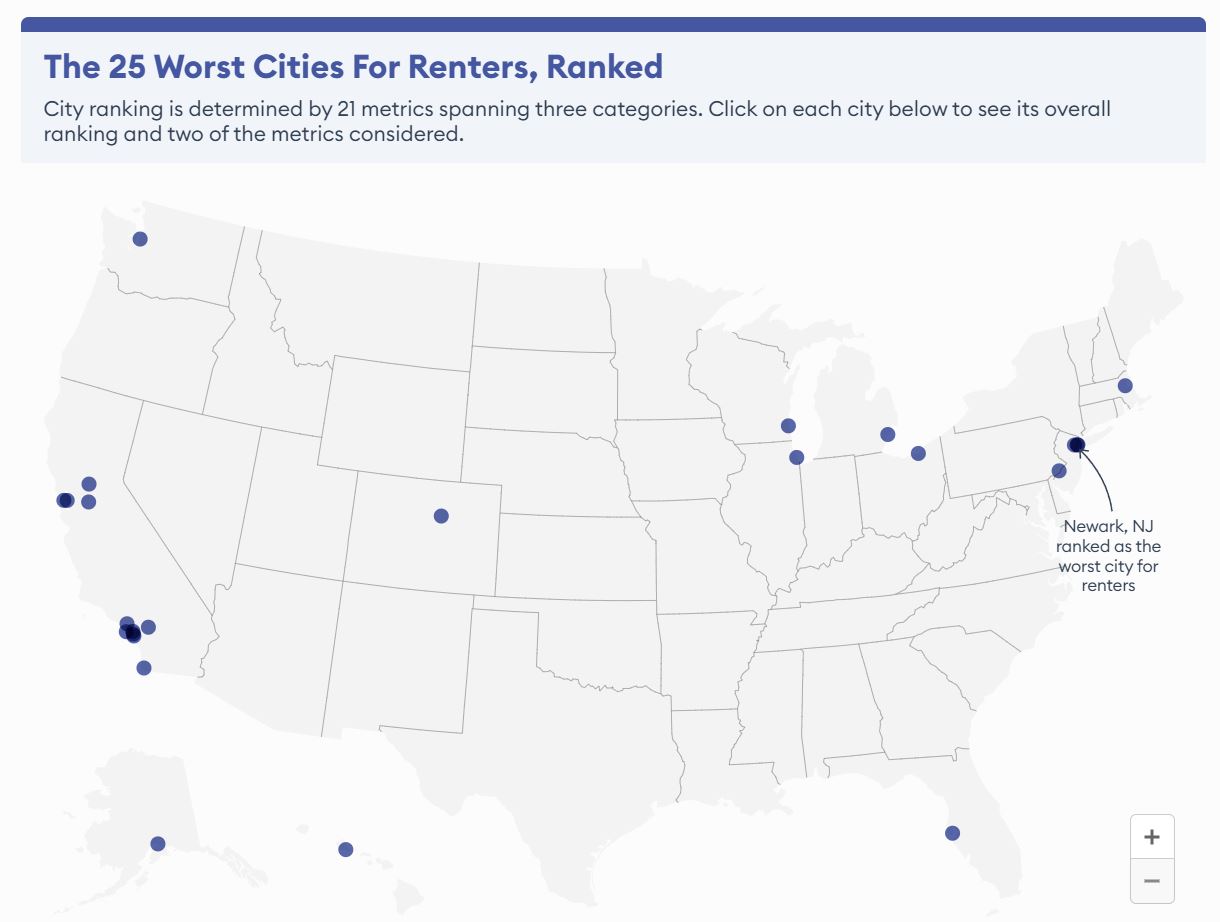
With affordability top of mind, Forbes Advisor analyzed 21-rent related metrics within the 95 most populated cities to uncover The Best and Worst Cities For Renters.
Here is a breakdown of the eight California cities that ranked among the 15 worst for renters:
- Long Beach, second worst
- Anaheim, fourth worst
- Oakland, fifth worst
- San Francisco, seventh worst
- Irvine, ninth worst
- Sacramento, 12th worst
- Santa Ana, 14th worst
- Riverside, 15th worst
Highlights for California cities:
- Long Beach, second worst city for renters
- Sixth worst city in our affordability category, and second-worst in our availability and amenities category.
- Anaheim, fourth worst city for renters
- Second-worst city in our affordability category, and sixth worst in rental price changes in the last year ($105).
- Oakland, fifth worst city for renters
- Tenth worst city in the average monthly price per square foot of a rental ($3.27).
San Francisco ranked as the seventh worst city for renters, Irvine ranked ninth worst, Sacramento ranked 12th worst, Santa Ana ranked 14th worst and Riverside ranked 15th worst.
Commenting on the study, Les Materson, Deputy Editor on the Forbes Advisor Insurance team says:
“Our study found that Lincoln, Nebraska is the best place for renters with its relatively affordable costs and above-average availability.
Methodology
To uncover the best and worst cities for renters in America, Forbes Advisor analyzed the 100 most populous cities (95 of which had available data) across three categories: affordability, availability and amenities, and lifestyle and safety. We considered the following 21 metrics within those categories:
Affordability – Total Points: 40
- Median rent as a percentage of annual household income: 10% of the total score. Data comes from Zillow (May 2024) and the U.S. Census Bureau (2018-2022).
- Average price per square foot of a rental: 10% of the total score. Data comes from RentCafe, March 2024. For more info see RentCafe.
- Year-over-year rental price changes: 10% of the total score. Data comes from Zillow, May 2024.
- Median monthly rental price:10% of the total score. Data comes from Zillow, May 2024.
Availability and Amenities – Total Points: 30
- Available rental units per 100,000 households: 5% of the total score. Data comes from Zillow (May 2024) and the U.S. Census Bureau (2018-2022)
- The percentage of non-apartment rentals: 5% of the total score. Data comes from Zillow, May 2024.
- The percentage of units with air conditioning: 4% of the total score. Data comes from Zillow, May 2024.
- The percentage of units with a pool: 4% of the total score. Data comes from Zillow, May 2024.
- The percentage of units with on-site parking: 4% of the total score. Data comes from Zillow, May 2024.
- The percentage of units allowing pets: 4% of the total score. Data comes from Zillow, May 2024.
- The percentage of units with in-unit laundry: 4% of the total score. Data comes from Zillow, May 2024.
Lifestyle and Safety – Total Points: 30
- Unemployment rate: 3.5% of the total score. Data comes from the Bureau of Labor Statistics, March 2024.
- Walk Score: 2.5% of the total score. Data comes from Walkscore.com, 2024.
- Bike Score: 2.5% of the total score. Data comes from Walkscore.com, 2024.
- Transit Score: 2.5% of the total score. Data comes from Walkscore.com, 2024.
- ParkScore: 2.5% of the total score. Data comes from The Trust for Public Lands, 2024.
- Dog Parks per 100,000 residents: 2.5% of the total score. Data comes from The Trust for Public Lands, 2024.
- Entertainment establishments per 1,000 establishments: 2.5% of the total score. Data comes from the U.S. Census Bureau, 2021.
- Food establishments per 1,000 establishments: 2.5% of the total score. Data comes from the U.S. Census Bureau, 2021.
- Property crime rate per 1,000 residents: 4.5% of the total score. Data comes from NeighborhoodScout, 2022.
- Violent crime rate per 1,000 residents: 4.5% of the total score. Data comes from NeighborhoodScout, 2022.